Pretty printers are awesome, but the setup can be a real pain. Here’s a quick summary of a day’s work so you can skip to the end.
What’s this all about?
I wrote decodeless/offset_ptr, a relative pointer that still works between address spaces — saving to disk, CPU/GPU, shared memory, whatever. There’s also offset_span, which is just {offset_ptr, size}. Problem is, when you hover over them in a debugger you get garbage:
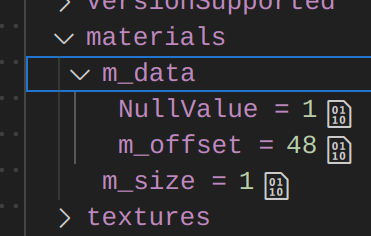
To see what the offset pointer points to I’d have to evaluate *(MyType*)((char*)mySpan + mySpan.m_offset) and who wants to type this instead of just want to hovering over a variable. The offset pointer works fine to code with but debugging is terrible. This is where debug visualizers come in.
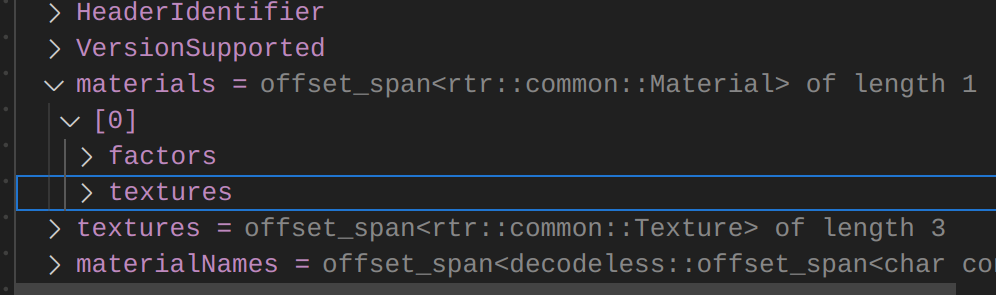
This is a great example where the debugger should show the abstract representation of the object, not the raw data. This is the end goal, which is achievable with natvis and gdb pretty printers:
Natvis
Visual studio provides Natvis — “custom views of C++ objects”. To correct the above for offset_ptr, the visualizer is tiny:
<?xml version="1.0" encoding="utf-8"?>
<AutoVisualizer xmlns="http://schemas.microsoft.com/vstudio/debugger/natvis/2010">
<Type Name="decodeless::offset_ptr<*>">
<Expand>
<Item Name="[ptr]" Condition="m_offset != 1">*($T1*)((char*)this + m_offset)</Item>
</Expand>
</Type>
</AutoVisualizer>
When visual studio sees a “decodeless::offset_ptr<*>” type, it replaces it with a virtual “[ptr]” member of what it actually points to. Suddenly visual studio can understand what an offset pointer is and even follow them! The type returned in the virtual [ptr] attribute is the offset pointer’s template T and visual studio displays it as any other regular type T — even other offset pointers.
The offset_span can have its own .natvis file with an <ArrayItems> attribute to present what it points to as a regular array.
The fantastic thing about natvis is how nicely it flows through dependencies into the debugger. You can work with .natvis files directly and even update them at runtime. It can also embed itself into .pdb debug files and wind up next to the final executable without messing around with paths back to the original natvis file.
CMake has support for natvis. Trivially add the natvis files as target sources. Either in add_executable()/add_library() or later with target_sources().
You get errors when natvis fails to parse or evaluate. This has to be enabled, but the docs are solid.
GDB Pretty Printers
GDB doesn’t understand natvis.
Well, there is limited MIEngine integration and vscode can technically pass a single "visualizerFile" natvis file. You’d have to manually combine all your natvis files into one, update them when things change, and in my experience it rarely works anyway as support is incredibly limited.
So GDB doesn’t understand natvis.
GDB does have pretty printers though. These are basically python scripts that allow you to override how certain types are printed. They’re more powerful than natvis, but also not at all user friendly. The good news is that IDEs such as vscode parse gdb output, so custom pretty printers can work in IDEs too.
There are projects such as https://github.com/rokups/natvis4gdb, which are built on top of pretty printers. I’m not sure how much natvis features it supports. This also wasn’t an option for me as I want a library that works out of the box, without downloading and setting up extra gdb plugins.
The docs are here. They don’t cover more than the real basics, but I’d recommend reading them before blindly following other guids or ChatGPT. The idea is you define a python class for your type, write a to_string() method and then tell gdb to wrap types with your class that match some pattern/regex.
Things to watch out for:
- There are multiple ways to inject your pretty printer class. Which is canonical? E.g.:
gdb.pretty_printers.append()gdb.pretty_printers['pattern’] = ...gdb.printing.RegexpCollectionPrettyPrinter()gdb.printing.register_pretty_printer()- When debugging the pretty printer you can
source my_pretty_printer.pyfrom within gdb, but any old printers may remain registered so errors could be appearing from previous iterations unless you restart gdb - How are you meant to handle templates? So far examples literally just match the type as a string, which sounds error prone if the type is complicated.
- The handling of arrays or children may require changing
display_hint() - Children can be expensive if they’re evaluated all at once. I wrote a quick lazy evaluation class myself, but this should be part of the API — maybe it is, but I haven’t found it. Maybe related to the
ValuePrinterbase class?
Deploying a Pretty Printer
Once you have your pretty printer you still need to point gdb to it. It would be stupid if users had to manyally source each pretty printer every time they started debugging.
- A slightly better approach is to load them in your
~/.gdbinit, but that’d be for your whole system - A slightly better approach is to add a
.gdbinitfor your current project (beware, you may need toset auto-load safe-path <path>) - A much better approach is to reference a pretty printer in the debug sections of the binaries you create
There are two options for embedding pretty printers:
- Embed a link to the pretty printer script, but I imagine this is error prone. Do you use a relative path? What happens if you use your library with a pretty printer from a different directory or in multiple binary files? An absolute path? What happens if you copy your binary to another system?
- Embed the script contents itself. Now we’re talking. Any binary that consumes your library with an embedded pretty printer will aggregate all the printers and it’ll “just work”
How can this be done though? Options:
- The docs suggest to compile
asm(... ".ascii \"class test_cmd (gdb.Command):\\n\"\n". Lol no, I’m not typing my whole python script like that. - ?
That’s it? OK, I’ll figure it out myself. This is creating a .o ELF object file. Specifically, a .debug_gdb_scripts section in an object file. The section is almost a raw python file, but it has some extras:
- There is a one-byte header with the value
4. The rest is text. - The first line is the name of the file, with a newline obviously.
- Then the file contents but null terminated.
I wrote a trivial C++ program to write just the binary part of the section (i.e. convert pretty_printer.py -> pretty_printer.bin with the above) and then tackled making a .o file with it. Having cmake compile this program and then immediately use it in add_custom_command() meant I didn’t need to e.g. require python be installed. I did try writing the binary file with cmake directly. It did not go well. Anyway, on to the next bit.
To embed the binary .debug_gdb_scripts section data in an object file:
- For plain data,
ldorobjcopycan be used. - There is
objcopy --add-sectionbut I could not get this to work. It seems to always want an input file and I wasn’t getting a.debug_gdb_scriptssection when starting with an empty .o file. - There is a neat trick with
objcopy --rename-sectionand starting with binary data. I.e.objcopy -I binary -O <output_format> -B <arch> --rename-section .data=.debug_gdb_scripts pretty_printer.bin embedded_pretty_printer.o. The only downside is that I don’t want to have to specify an architecture since this is just plain data.
I ended up with the latter and just accepting I had to pick an architecture:
objcopy -I binary -O elf64-x86-64 \
    --rename-section .data=.debug_gdb_scripts \
    pretty_printer.bin embedded_pretty_printer.o
Now compile embedded_pretty_printer.o into the library or executable and the pretty printer will just work, right? Almost.
Lets quickly validate that the object file and binary has the pretty printer:
objdump -s -j .debug_gdb_scripts embedded_pretty_printer.o
objdump -s -j .debug_gdb_scripts myexe
This should print the contents of the original script.
Finally, gdb needs to be told it’s OK to execute this arbitrary python code. To do that, add this to ~/.gdbinit:
set auto-load safe-path <binary directory or parent>
Or if you’re using vscode, add the following to launch.json:
json
"setupCommands": [
    {
        "text": "set auto-load safe-path .",
        "description": "enable loading pretty printers",
        "ignoreFailures": false
    }
],
The result of all of this can be seen in https://github.com/decodeless/offset_ptr/pull/6.
There was a pile more cmake frustration, trying to add generated .o files as dependencies of a header-only library, but this post is long enough. See the use of add_custom_target().
Now cross platform libraries can have debug visualizers that “just work” (with set auto-load safe-path on linux).
… piece of cake /s